Answer
EEDI = Energy Efficiency Design Index. It expresses the ship’s design CO₂ efficiency in terms of CO₂ emitted per unit of transport work. IMO describes it as a minimum energy-efficiency level per capacity-mile for different ship types and sizes.
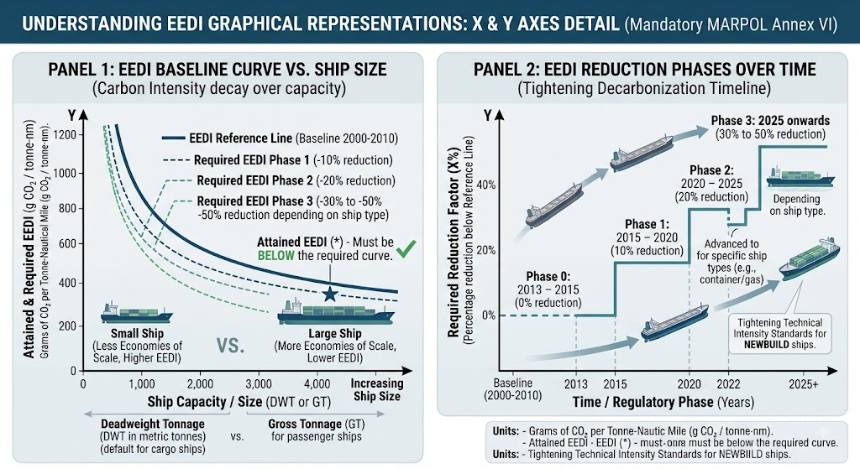
- Horizontal Axis (X-Axis): Ship Capacity / Size
- Units: Deadweight Tonnage (DWT) in metric tonnes) for bulk carriers, tankers, gas carriers, container ships; or Gross Tonnage (GT) for passenger ships.
- Vertical Axis (Y-Axis): EEDI Value
- Units: Grams of CO2 per Tonne-Nautical Mile (g CO2/tonne.nm).
- Key Characteristics:
- Curve Shape: Hyperbolic decay curve—larger ships naturally achieve lower CO2 emissions per tonne-mile due to economies of scale.
- Rule: A ship's Attained EEDI point must sit on or below the Required EEDI curve for its specific phase.
EEDI Reduction Phases Over Time (IMO Decarbonization Timeline)
This graph illustrates the progressive tightening of EEDI reduction targets across implementation phases.
- Baseline: 2000–2010 average ship efficiency.
- Phase 0: 2013 – 2015 (0% reduction).
- Phase 1: 2015 – 2020 (10% reduction).
- Phase 2: 2020 – 2025 (20% reduction; advanced to 2022 for container/gas ships).
- Phase 3: 2025 onwards (30% to 50% reduction depending on ship type).